End to End example
-
Host the
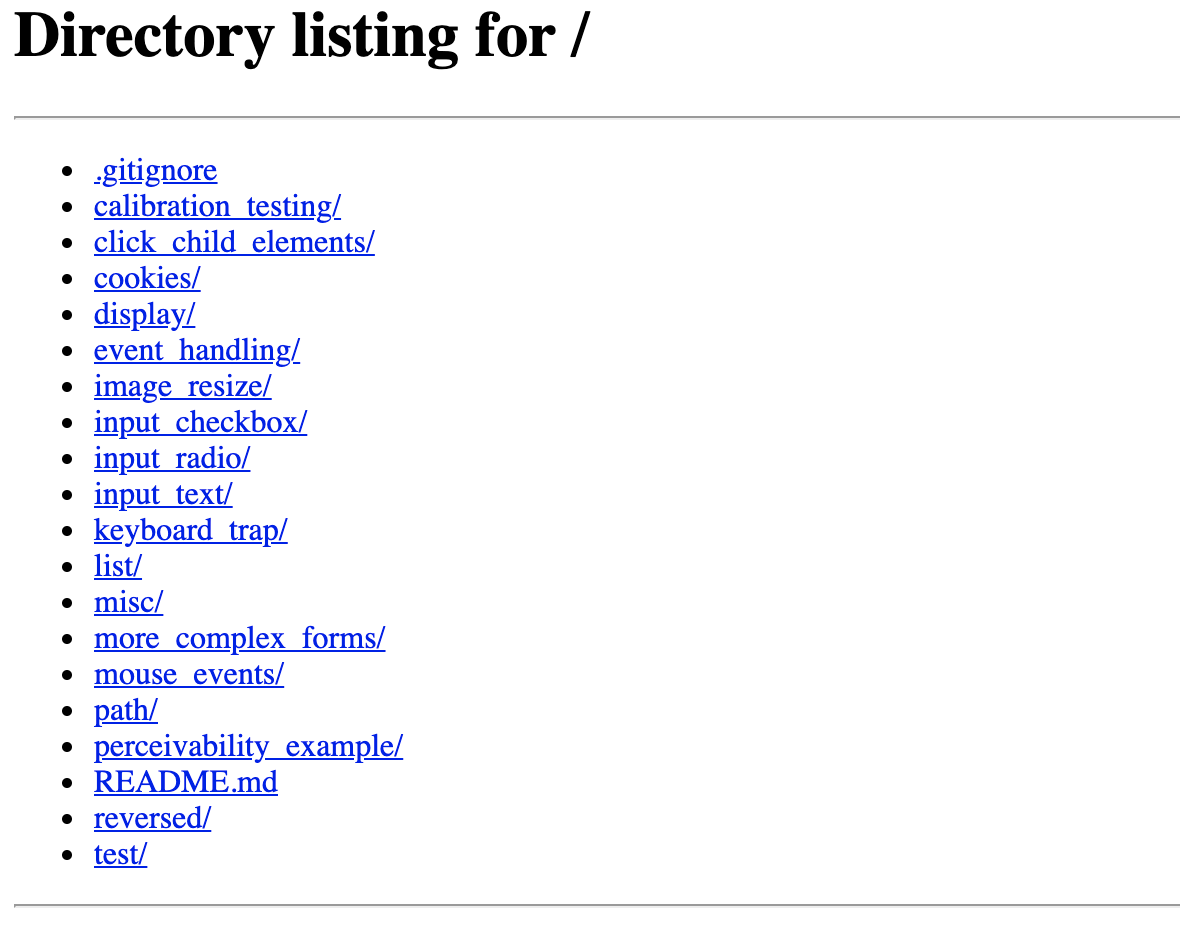
sandbox(should be available on http://localhost:8080)% cd demodocusfw/tests/sandbox % python -m http.server 8080Go to http://localhost:8080 in any web browser and see:
-
In a new terminal window, run a simple example from the sandbox, like
list/partaccessible_1. This will take about 2-3 minutes to run on most laptops.% python crawler.py http://localhost:8080/list/partaccessible_1/example.html --output_dir e2e_example/The console will have a lot printed to it, but it should start with:
2020-09-24 08:01:38,121 root:71 INFO MainThread Logging to stdout
Serving e2e_example on port 50372 in thread Thread-1
2020-09-24 08:01:38,125 crawler:189 INFO MainThread Crawling http://0.0.0.0:8080/list/partaccessible_1/example.html
2020-09-24 08:01:39,992 crawler.webaccess:180 INFO MainThread Page load #1
127.0.0.1 - - [24/Sep/2020 08:01:40] "GET /raw_modified.html HTTP/1.1" 200 -
2020-09-24 08:01:48,562 crawler.webaccess:189 INFO MainThread http://0.0.0.0:8080/list/partaccessible_1/example.html took 0 seconds to stabilize.
...
and end with :
... 2020-09-24 08:03:38,298 crawler.controller:186 INFO MainThread -- Crawling state 4 -- 2020-09-24 08:03:38,298 crawler.controller:199 INFO MainThread found state 0: click on /html/body/ul/li[4]: 0.9 2020-09-24 08:03:38,298 crawler:253 INFO MainThread Generating reports for http://0.0.0.0:8080/list/partaccessible_1/example.html 2020-09-24 08:03:38,301 crawler.graph:234 INFO MainThread Graph successfully saved to: /Users/username/demodocus-framework/e2e_example/full_graph.gml /Users/username/anaconda3/envs/py38/lib/python3.8/site-packages/networkx/drawing/layout.py:730: RuntimeWarning: divide by zero encountered in true_divide costargs = (np, 1 / (dist_mtx + np.eye(dist_mtx.shape[0]) * 1e-3), Stopping server loop Stopping server loop Stopping server loop -
You should see a new directory created –
e2e_example/. This contains all of the files generated bydemodocus. You should expect to see all of the following files, though the<user-model>_paths_df.csvfiles depend on the configured users.├── LowVizMouseKeyUser_paths_df.csv ├── SuperVizMouseKeyUser_paths_df.csv ├── VizKeyUser_paths_df.csv ├── VizMouseKeyUser_paths_df.csv ├── analysis_report.md ├── analyzed_data.json ├── analyzed_full_graph.gml ├── crawl.csv ├── crawl.log ├── crawl_config.txt ├── element_map.json ├── full_graph.gml ├── network_layouts │ ├── fr_0.0.png │ ├── fr_0.2.png | ... │ ├── kk_0.0.png │ ├── kk_0.2.png | ... ├── raw.html ├── raw_modified.html ├── screenshots │ ├── state-0.png │ ├── state-1.png | ... └── states ├── state-0.html ├── state-1.html | ... ├── state-fields-0.json ├── state-fields-1.json | ... ├── state-template-0.html ├── state-template-1.html | ... -
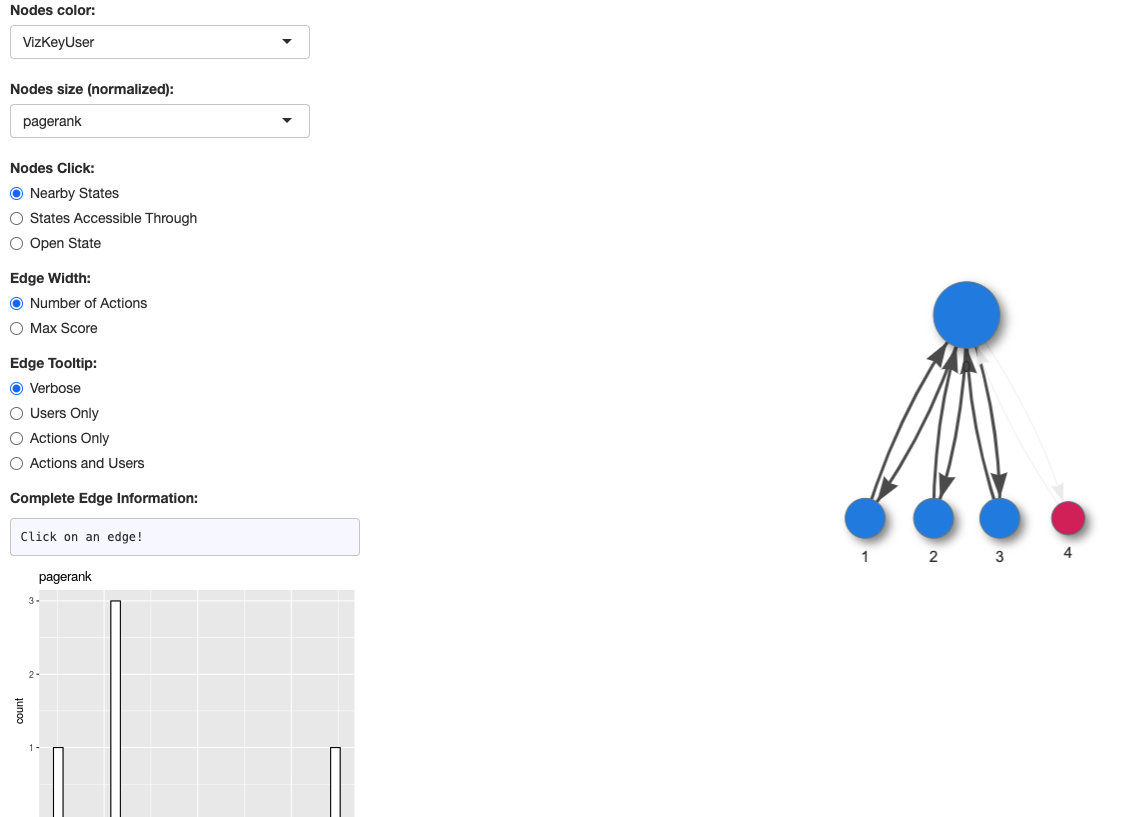
Open
e2e_example/analyzed_full_graph.gmlin thegraph-app. Be sure to change/absolute/path/to/e2e_exampleto the path on your system.% docker run -v /absolute/path/to/e2e_example:/usr/src/crawl_output -p 8081:8081 \ demodocus-graph-app:latest \ Rscript --vanilla graph_app.R crawl_output/analyzed_full_graph.gmlGo to http://0.0.0.0:8081 in any web browser – your app should look the same as what is below. For more information on the functionality, see the demodocus-graph-app README.
-
Open the results in the
web-app. Since the web app cannot access local files, we are first going to need to copy them into the app public directory. Copy the directorye2e_exampleintoweb-app/public/crawls. Once the files are copied over, you can then run
% cd web-app && npm run serve
to start the web app. Seperate instructions for running with docker can be found in web-app README.
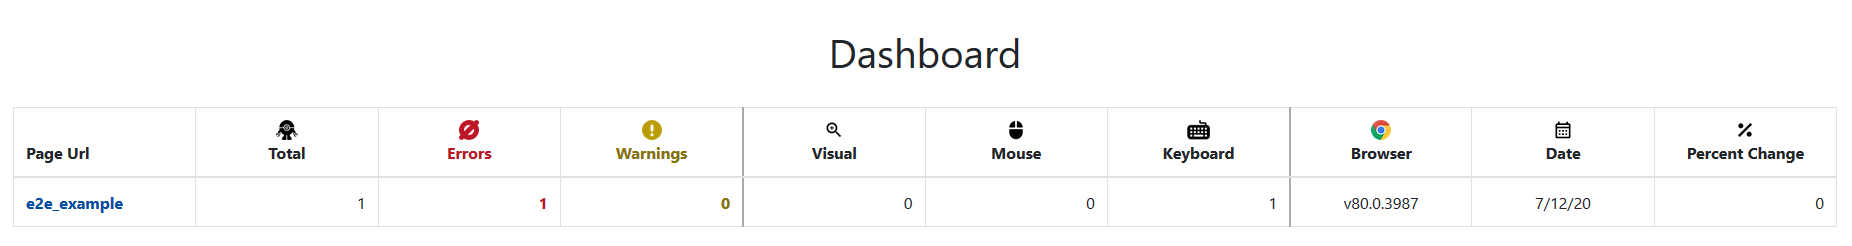
You can the load the page by visiting http://localhost:8081/, changing the port number as necessary. When the page first loads, you should see a dashboard that looks like -
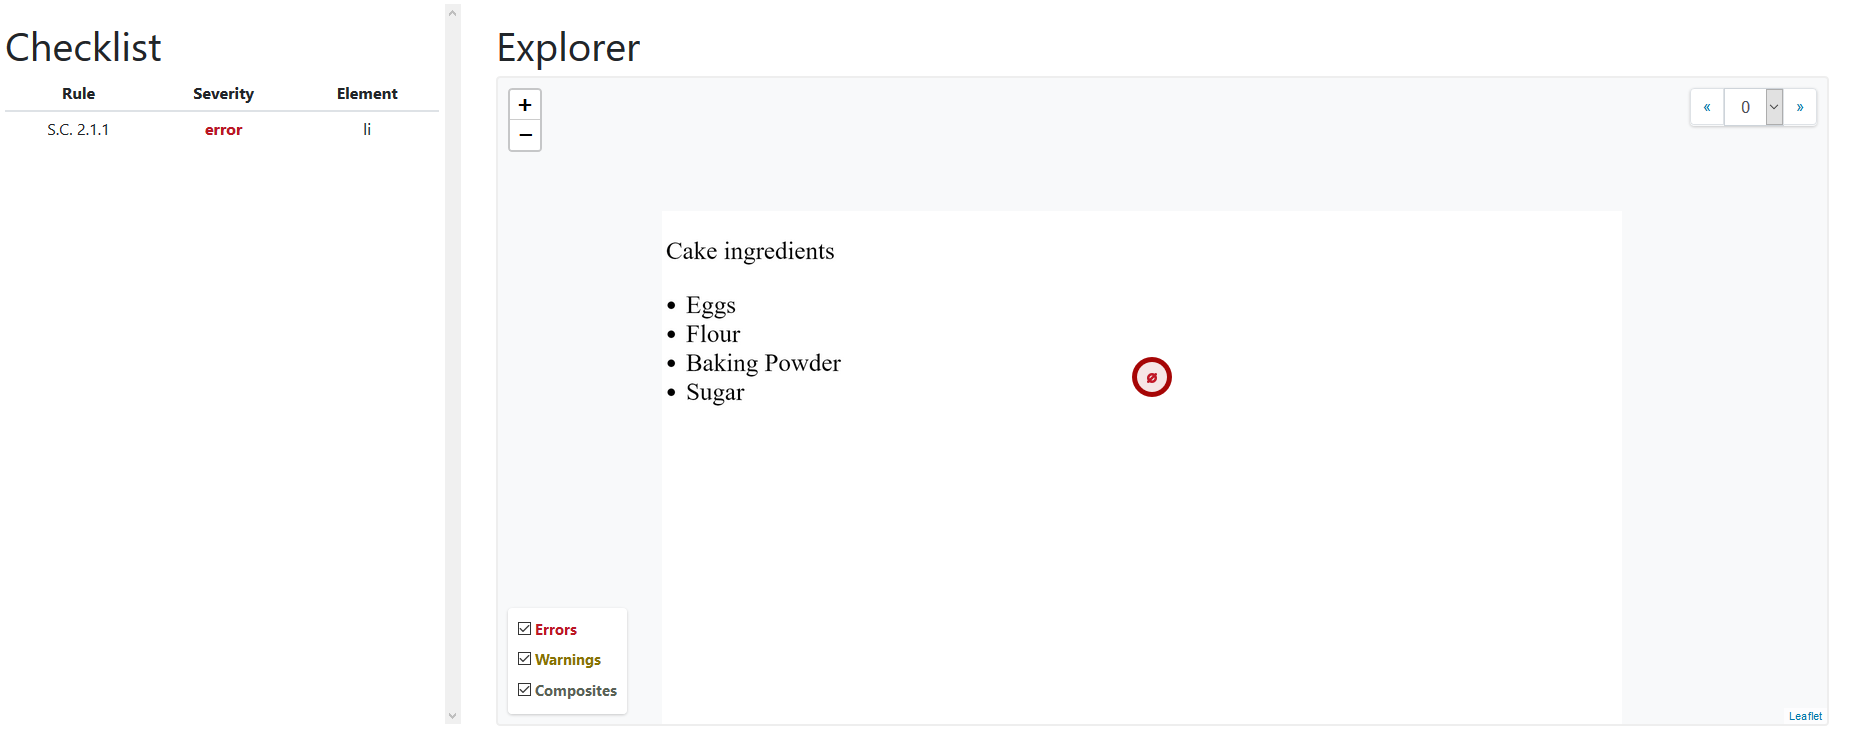
Clicking on the e2e_example link will take you to the inspection pane.
For more information please see the Web App README