Running Crawls
Command-line options
To start the crawler from the command line, serve up your copy of the sandbox
(see README.md), and note the port in case you need to change
it), then give crawler.py a URL, command, or other “entry point” specific to
your type of interface to start crawling:
% python crawler.py http://example.com/
You can also pass a file with a list of entry points, one per line, to crawl:
% python crawler.py -i my-list-of-urls.txt
Logging options include -d or --debug for debug-level or -v or --verbose
for info-level output. Default logging is defined in the configuration module as
LOG_LEVEL.
The crawl output directory may be passed as a runtime option using
--output_dir. This value is also set by default in the configuration file as
OUTPUT_DIR.
Configuration options
To see the browser in action during crawling, set the configuration variable
HEADLESS to False. This is True by default because seeing multiple
browsers pop up and run autonomously should only happen when you are you sure
you want it to happen.
By default, the crawler will use all available user models. You can specify a
subset with the configuration option USER_TYPES.
By default, the crawler will generate a report directory under builds/crawls
with timestamp-based name. In that directory will be a crawl log file, a crawl
metrics file, a directory for every crawled entry point with state/edge GML, a
states directory containing contents of every state visited from the entry
point, a screenshots directory containing PNG screenshots of every state
visited from the entry point, and an accessibility analysis report in Markdown.
The state identifiers should match what is listed in the top-level crawl metrics
file.
The default is to generate all these outputs, but you can specify generating
only some of these reports. For example, to generate only the crawl metrics and
GML files (no DOM, no analysis), use REPORTS:
REPORTS = ['metrics', 'gml']
To capture a screenshot of every distinct state, which will be stored in a
directory called screenshots within the output directory, set
SCREENSHOTS = True.
To add a delay when new states are found to make it easier to demonstrate the
work Demodocus is doing, set DELAY to a value in seconds. Note: this probably
only makes sense when using HEADLESS = False. The default is 0 for no delay.
By default, the crawler is single-threaded. To use multiple threads, set
NUM_THREADS to an integer value greater than 1 (the default). Four seems to be
a good balance point for most desktop-class machines; this is common enough that
we have a built-in configuration mode for it:
% python crawler.py --mode demodocusfw.config.mode_fourthreads http://example.com/
Multithreading works with a separate MultiController. Both this and the
single-threaded Controller call up visited states by setting them directly
into the browser with document.write. If you want to use MultiController
with only one thread, set MULTI to True without changing NUM_THREADS.
If NUM_THREADS is set to a value greater than 1, there is no need to add
MULTI, but it shouldn’t cause problems if you do, as the crawler checks both
values.
Reduced Crawls
An exhaustive crawl of a webpage with many elements can be time intensive, which
is impractical if quick results are needed. In addition, an exhaustive crawl
produces many states, which can be distracting for the non-expert user.
Specifying REDUCED_CRAWL = True in the config addresses this challenge. In a
reduced crawl, when the crawler explores a state, it only explores content that
it knows has changed from the previous state.
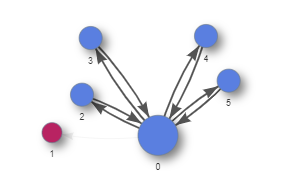
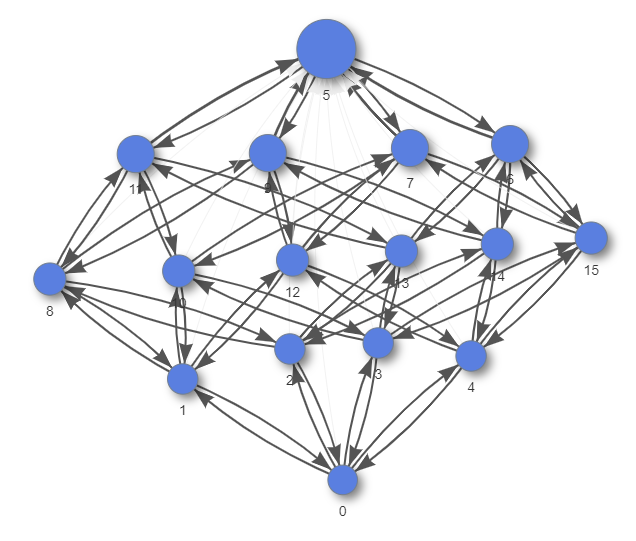
For an example of what is saved / lost in a reduced crawl, consider an example with 4 independently expandable list items. In a reduced crawl, the crawler expands and then collapses each list item in turn, but it does not try to expand multiple list items at once. This reduces combinatorial explosion of considering all permutations of the list items being expanded as seperate states. The reduced graph and full graph are shown below.
- In the reduced graph, we see that the KeyboardUser can toggle each item in the list but cannot access the “show all” button.
- A full crawl would show that the KeyboardUser can get to the “show all” state by expanding every item.
Reduced graph:
Full graph:
Analyzing Accessibility
The crawler module will automatically analyze the graphs for each UserModel
and recommend accessibility improvements. See Analysis for more
information on the analysis of a crawl.
If you wish to re-run just the analysis on a page that has already been
successfully crawled, utilize util_scripts/run_analysis.py. The output
directory containing the crawled results (where the states/ folder and
full_graph.gml are stored) is required. Similar to crawler.py, you can also
specify the configuration used (--mode), which should be the same as the
configuration used to crawl. Other flags are also preserved: -d or --debug
for debug-level, -v or --verbose for info-level output. This can be very
useful if you want to make changes to the analysis code. Below is an example:
% python ./util_scripts/run_analysis.py --mode demodocusfw.config.mode_accessibility_vision_users_tall build/crawls/20200304T135605Z
Comparing Multiple Crawls
The util_scripts/compile_outputs.py script cherry-picks summary data and
statistics from a list of crawls and outputs them to one .csv file for easy
analysis. You must specify a path that contains all of the separate output
directories or a .txt file that specifies one output path per line. Use the
-o argument to specify the filepath of the output .csv from this script, or
rely on the default that places aggregated_metrics.csv in the current
directory. Below is an example:
% python ./util_scripts/compile_outputs.py build/crawls -o other/dir/for/data_for_crawls.csv
Below is a data dictionary for the values found in the aggregated_metrics.csv:
- entry_point (string) – URL crawled
- users_crawled (string) – list of
UserModels crawled, separated with a; - total_runtime (float) – total time (in seconds) to crawl the
entry_point, not including the analysis time (usually only a few seconds extra) - build_runtime (float) – time (in seconds) to build the graph using the
OmniUser, which should always be less than thetotal_runtime - num_states (int) – number of states discovered by the
OmniUser, which is an upper limit for the number of states aUserModelcan discover - num_edges (int) – number of edges discovered by the
OmniUser, which is an upper limit for the number of states aUserModelcan discover - num_dynamic_states (int) – number of dynamic states discovered by the
OmniUser, which do not count the entry state or any states that are links to other pages. - For each
UserModelbesidesOmniUser, we also capture the following information:- **
_num_states** (*int*) -- number of states accessible to the given `UserModel`. - **
_num_edges** (*int*) -- number of edges accessible to the given `UserModel`. - **
_num_dead_end_edges** (*int*) -- number of edges that are inaccessible for the given `UserModel` and lead to at least one state not being reachable.
- **
- For each of the 4 WCAG success criteria we track (2.5.5, 2.1.1, 2.4.7, and 2.4.3) you will see a count, which denotes count of that type of violation that the crawler reported. For example, a value of 47 for S.C._2.5.5 means there were 47 violations for WCAG Success Criterion 2.5.5.