9. Viewing and Analyzing Results
Viewing and Analyzing Results
We discussed using reporters in the last section to capture InSpec's output in convenient JSON files. JSON reports like these are a transport medium for data; they are generated because they are intended to be ingested by some other tool or process later.
Let's imagine the case where we have been running InSpec scans -- a lot of InSpec scans -- and we want to examine all of our reports to dig into the root causes of failing tests. We will do this using the Heimdall security data visualization application.
Heimdall
Take a look at Heimdall's page on the MITRE SAF website for a quick description of what the tool is and what it does. You can also check out the Heimdall docs.
We won't get too far into all the cool things Heimdall does here, because this class is focused on InSpec. Suffice to say that Heimdall is our visualization tool for actually understanding InSpec's reports.
Wait, do I have to use Heimdall with InSpec?
No. There are plenty of dashboarding solutions that are widely used for aggregating and visualizing security data (ELK Stack and Splunk come to mind). Your team may already use one (or several).
The MITRE SAF team favors Heimdall because we wrote it it is a) free, b) extremely effective in normalizing and visualizing security data from disparate sources and tools, and c) free.
Wait, does Heimdall only work with InSpec reports?
No. Heimdall can ingest security data from an ever-growing list of commercial and open-source security tools. See the MITRE SAF Normalize capability for details.
Heimdall Lite
We're going to use Heimdall Lite, the demo version of Heimdall that is freely accesible to the internet, for this part of the class.
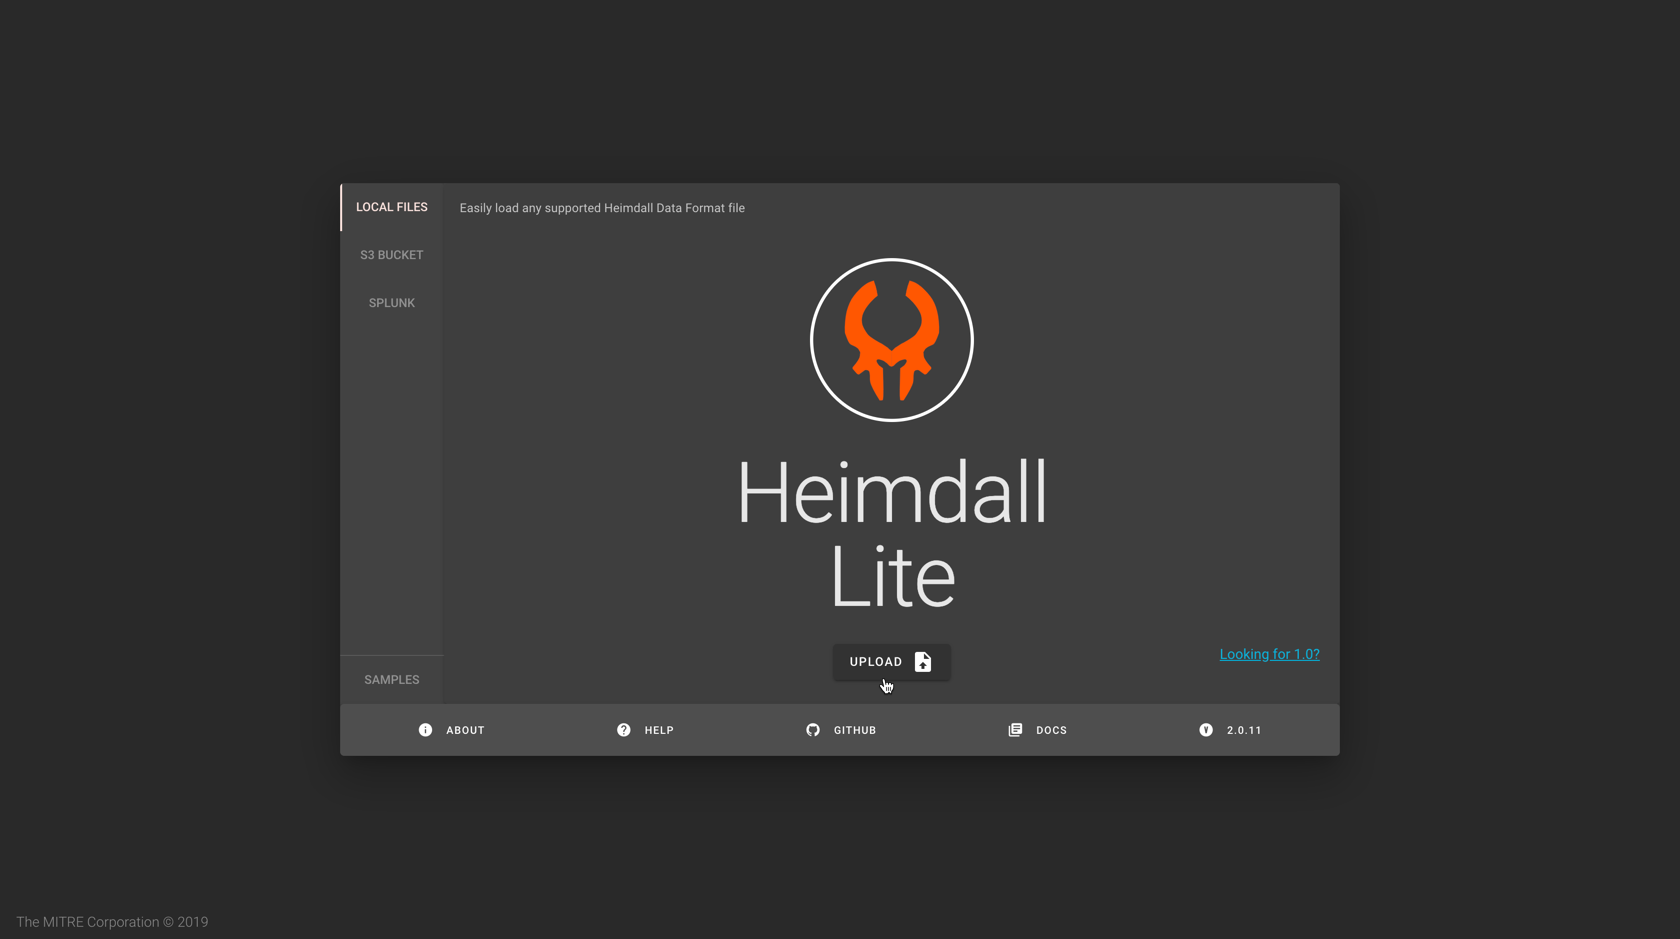
Navigate to the web page for Heimdall Lite.
Click on the Upload button and navigate to your json output file that you saved from your previous step. Select that file then click open.
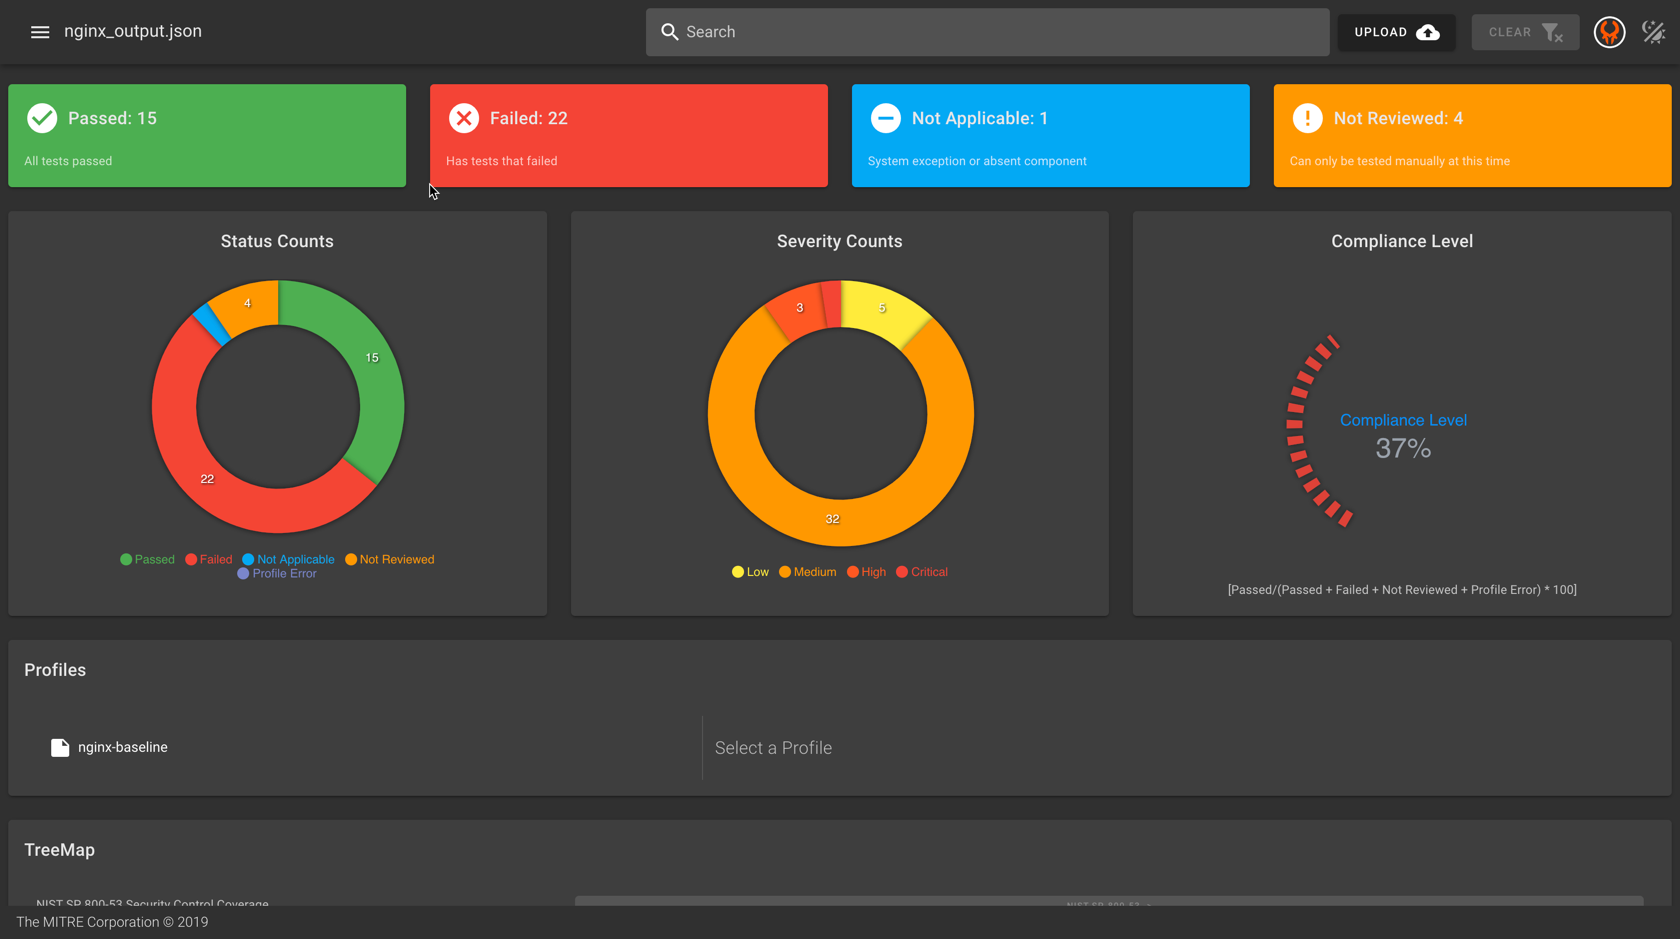
This will allow you to view the InSpec results in the Heimdall viewer.

Your visualization should look similar to the following:
