Overview
The Demodocus (pronounced deh-MAH-do-kus) Framework enables automated analysis of web site accessibility. More than just a static page analyzer, Demodocus will simulate real users with a variety of abilities as they navigate through all potential page states, including invoking dynamic changes within single pages. Demodocus can then report on accessibility findings, with a focus on how individual pages will enable or provide barriers to different users as they navigate the site.
This framework is named after Demodocus, the blind poet from The Odyssey.
Technical approach
Demodocus generates a full state graph for a web site, in which a node is a distinct state of the DOM, JavaScript, and CSS, and an edge is a pair (element, action) representing some action that can be performed. This initial graph represent all possible states that fully able users should be able to reach. The framework then runs simulated users through the graph to determine which states are accessible by different models of users. These user models can simulate users with low vision, the ability to navigate the web with only a keyboard, or other combinations of abilities, including users with a full range of typical abilities.
From these simulations, the different potential paths and barriers navigable by different users are recorded and used as the basis of reporting and analysis of found issues and recommendations to developers for improving site accessibility.
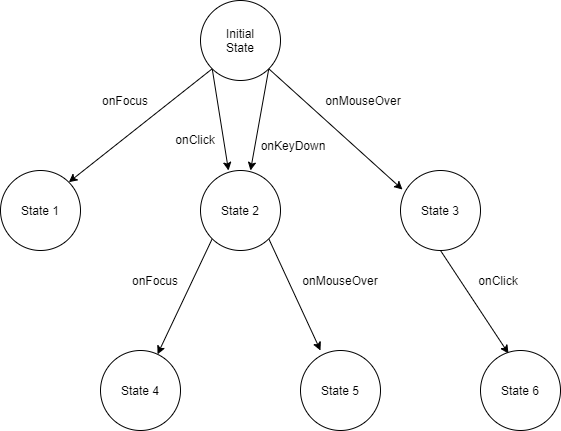
For example, in the image below, all of the states for a page are displayed with the user actions required to navigate between them.
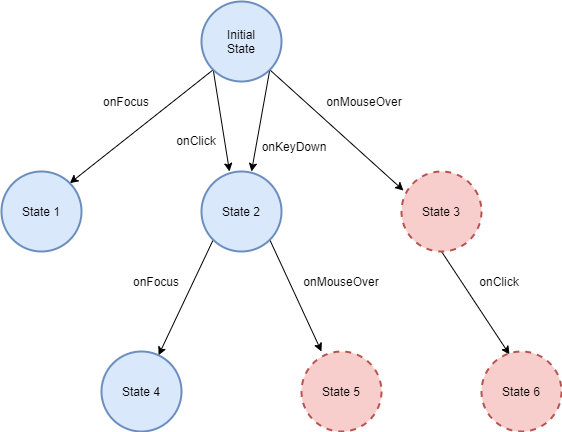
In the following image, we see that a user browsing with a keyboard cannot navigate to some page states; the transitions that require a mouse are barriers to this user, who does not use a mouse.
Research background
The web is the prominent way information is exchanged in the 21st century. However, ensuring web-based information is complicated, particularly with web applications that rely on JavaScript and other technologies to deliver and build representations. Static representations are becoming rarer, and assessing accessibility to ensure access to web-based information is available to all users is increasingly difficult given the dynamic nature of representations.
Read more in our literature review paper.
Project Structure
The project is made up of three main parts, each of which could be their own repository, but were included here together for ease at the current time. These include the Demodocus Framework, the Graph App, and the Web App. Short descriptions and their intended use are given below. In sum, the various parts hope to provide functionality for automatically crawling a page’s interactive elements for accessibility violations and then to provide analysis and diagnostic support both for technical and non-technical users.
Demodocus Framework
This is the primary function of the repository, responsible for all of the crawling and data collection on web sites. It is a selenium based web-crawler capable of triggering events on pages and registering the impacts of those actions in order to find accessibility violations. Most of the code for this part is found in the demodocusfw or util_scripts folders, with the exception of crawler.py, which acts as the runner for the program.
Graph App
The graph app is a R-shiny visualization application meant to help developers understand the network structure and technical details of crawls made by the Demodocus Framework. It includes a lot of technical information about the crawls along the edges and nodes of the displayed graph that can be used for developer analysis and debugging (e.g., what events can trigger the state transition). It will also allow users to click on various nodes to view a screenshot of the state that the node represents.
Web App
The web app is a vue based visualization of the crawl that is meant to intuitively display the results of a Demodocus crawl to non-technical analysts. Instead of displaying the whole graph network, the web app uses a leaflet map that allows the users to view errors where they occured on a page. If a sequence of actions was needed to find the violation, then the map allows the users to “simulate” the actions on the screenshot until they reach the state with the violation. This allows them to trace the sequence of actions that led to a violation.
Setup
See Setup for information on how to get started.
Usage
See the End-to-End example for an intended usage of demodocus.
Architecture
See the Architecture Introduction for implementaion information.